
Application designs are changing from single system to cross platform client/server utilizing the features of different types of computers, operating systems and networks. Planning the capacity of large computer installations using multiple systems requires an understanding of each of these areas and the inter-relationships between them.
The "Simalytic" (Simulation/Analytic)
Modeling Technique addresses modeling complex multiple-platform
computer systems at an enterprise level for capacity planning.
This technique uses a general purpose simulation tool as an underlying
framework and an analytic tool to represent individual nodes when
predicting capacity requirements in an enterprise model. This
technique combines both platform-centric tools (limited features
but detailed platform information) and general purpose tools (rich
low level features) to address today's large heterogeneous enterprises.
The 'Best of Both Worlds' refers to taking advantage of features
in the different techniques (simulation vs. analytic queuing theory)
as well as features in the different tools (platform-centric vs.
general purpose).
Data Processing has been one of the fastest, if not the fastest, evolving industries of the century. Applications that once would have been implemented as batch systems on a single computer are now multi-platform on-line transaction processing client/server systems with GUI (graphical user interface) front-ends on PWS's (programmable workstations) attached to departmental servers and mainframe repositories. These new applications utilize the features and services of different types of computers (mainframe, midrange, desktop) running different operating systems (MVS, Unix, OS/2, Windows, etc.) connected by a variety of communication network techniques (RPC, DCE, NFS, FTP, SNA, APPN, etc.) (Wilson 1994; Hatheson 1995).
As applications move into this new client/server world, how do we select the right systems at each level and, once selected, how do we insure those systems are the right size? If any one of them is too small the whole application will fail. If any are too big, the cost of running the application may exceed the revenue it generates. Neither is a very attractive situation.
The objective of capacity planning is to find the successful middle ground. Not too many years ago capacity planning meant watching a few metrics like processor utilization and the overnight batch window to determine when an upgrade would be needed. Today, planning the capacity of large computer installations with multiple systems requires an understanding of not only the operating systems, the platforms, the clients, the servers, the networks, the transaction systems, etc., but also the relationships between them. Once those relationships are defined and understood, the application's performance can be assessed against the business objectives and goals. Projected business volumes are then modeled to predict the capacity required to meet those goals at future volumes.
There are many modeling tools and techniques that address both performance and capacity for each of the systems in today's multi-platform environment (Pooley 1995; Smith 1995). The "Simalytic" (Simulation/Analytic) Enterprise Modeling Technique, introduced in this paper, provides a bridge across these existing tools to allow the construction of an enterprise level application model that takes advantage of models and tools already in place for planning the capacity of each system.
The major topics covered in this paper are:
What is capacity planning in the context of today's computer systems? Capacity is the maximum amount that something contains, but amount of what? Planning is making decisions based on the forecasting of future events using current and historical information. But the decisions to be made are sometimes contradictory and the information incomplete.
The capacity of a system can be measured many different ways, depending on the business the system supports. Usually, the way a system is measured centers around the performance of one or more of the applications. The system "has enough capacity" if everything is getting done when it is needed. This may sound like a simple statement, but the key to understanding the capacity of a system is the definition of the performance objectives. Without some goal at the business level there cannot be any meaningful statements about the capacity of a computer system as long as it continues to run. Without goals, a system is "out of capacity" only when it becomes so overloaded that it deadlocks or when some devices are so over-utilized that data is lost. Performance might be very poor, but we only know it is unacceptable if it is worse than the goal (Rosenberg and Friedman 1984; Wicks 1989; Wilson 1994; Domanski 1995 13).
Therefore, capacity planning is making decisions about the resource requirements of a given computer system based on forecasting future application performance using the goals and expectations of the business. That is a very broad and general definition, but it captures the objectives behind capacity planning. What do we have to buy and when do we have to buy it to make sure that the applications that run the business perform at the level required to insure the business succeeds?
Although there are still many important batch applications, discussions will center around transaction based applications for several reasons. First, the multi-platform client/server systems are generally focused toward small real-time units of work. Second, large batch applications generally have long execution times and points-in-time when all work must be completed. It just doesn't matter when a third of the paychecks are printed; they all must be ready when the time comes to distribute them. Third, transaction based applications are much more sensitive to the demands of momentary peak loads where batch based applications are more sensitive to scheduling issues and interference from higher priority workloads.
What is a transaction? Transaction processing systems, often referred to as OLTP (On-Line Transaction Processing), allow the end-user to enter a relatively small, independent unit of work into the system and receive some information in response in near real-time. Transactions, which can be defined from different points-of-view, include entering an order at a terminal (business transaction), an SQL command (database transaction) or some keystrokes followed by a carriage-return (interactive transaction). In one sense, each keystroke a user types in a text editor is a transaction because a small unit of work (the keystroke) is sent to the sever, acted upon and information is returned to the user (the keystroke is echoed). A transaction might be defined as messages received from or sent to 3270 terminals (which were really early PWS's) by an OLTP system such as CICS or IMS, or as logical units of work marked by "commit" commands by database systems such as Oracle and Sybase (BGS 1996).
The concept of a transaction is important because it is meaningful from the end-user's point-of-view. Transactions can be counted to establish load and measured to establish performance. The responsiveness of the transactions associated with an application determine if that application meets the needs of the business. A customer service representative can answer more inquiries when the requested information is presented in one or two seconds than if it is presented in ten or twenty minutes. That responsiveness has a direct impact on the business and modeling techniques can be used to predict application responsiveness at higher transaction rates.
The importance of looking at transaction processing is evident when we look at a hypothetical company as its data processing systems evolve over many years. The XYZ Company starts with a centralized batch orientated environment where all business functions use punch cards to enter data into the system and printed reports run the business. Special purpose servers are introduced to improve the productivity of some of the departments and over time XYZ has a decentralized environment. Different business functions on different servers causes communications and training problems, so the applications are merged together at the end-user's PWS using various techniques that preserve and hide the legacy applications while providing a single common interface for everyone.
The next three sections (and associated figures) describe the evolution of the XYZ Company from the perspective of the different computer platforms used in the company. Which operating system was chosen for each of the business functions was completely arbitrary and does not represent a recommendation. These figures represent one of many scenarios that could result in a situation where a company must plan for growth in a multi-platform environment. The intent of the figures is to show how initially the business functions can be strongly associated to a single platform and, over time, become dependent on the entire enterprise environment.
A general overview of the centralized batch environment is shown in Figure 1 The "Old" System. Capacity planning in this environment is focused on getting the reports delivered in the morning. Much of the real work of the company takes place "off-line" and the performance of the different applications is not a major issue. The business will continue to function for hours, or even days, using the last reports printed.
A capacity planning model of this system consists of a function that maps run times to input volume. Using an overly simplified example, if it takes three hours to process 1000 orders, then we can project it will take 4.5 hours to process 1500 orders. This model is easy to build and validate. Historical data provides many points on the function curve and the curve can then be projected to higher input volume. This technique will work with processor time, device utilization or almost any other measurable resource.

Figure 1 The "Old" System
At some point one of the department managers realizes that they could eliminate data entry costs and get more up-to-date information by using an on-line system. As XYZ Company does not have any policy or direction about distributed systems, the manager installs a turn-key system where both hardware and software are provided by the vendor. Another department manager sees the benefits and installs their own on-line system. Of course, they need different software which comes from a different vendor who uses different hardware. After a while, XYZ Company has a number of systems and looks something like Figure 2 The "New" System.
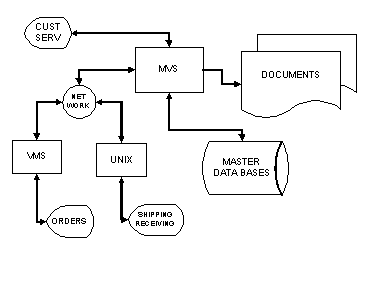
Figure 2 The "New" System
Capacity planning in a decentralized environment is still fairly straightforward. Even though each system sends the old card data to the MVS system for nightly processing, each system is an island unto itself. If the Order Entry workload outgrows the VMS system, the Order Entry users will see a performance delay, but the Shipping and Receiving users will not be impacted. As long as the nightly batch runs get done and the reports printed (which now also means downloaded to the departmental systems), the business continues to function.
The introduction of transaction processing complicates modeling performance in this environment, but the transaction and batch workloads remain, for the most part, isolated by shift. Modeling the daytime transaction processing workload requires more sophisticated queuing theory or simulation tools, but the overnight batch is forecasted much the same as before because it is most often a sequential process. If the performance of a database deteriorates with volume, then the function from above might be five hours to process the 1500 orders. The number of orders changes relatively little from one batch run to the next so the model can be validated and revised at intervals. However, an increase in the number of transactions from Customer Service will be disproportionately concentrated during the daily peak. The much more complex nature of OLTP requires modeling tools to take into account the bursts of transaction arrivals and the increase in response times due to queuing in different parts of the system.
The major change happens when the company realizes that the large number of different systems and user interfaces are causing problems for employees to communicate and making cross-training much too difficult. The company takes advantage of the existing LAN infrastructure and provides the users with a single common GUI as shown in Figure 3 The "Client/Server" System. There are many different techniques and products to accomplish this (Domanski 1995). Which are chosen really doesn't matter, but what is important is understanding that any of the client applications on any of the PWS's can, and will, send transactions to several of the legacy applications to provide the end-user a screen of "complete and interrelated information". For example, the Order Entry user may type in the name of an existing customer and get not only their address but any pending or past orders and the status of their account. This may provide better service, but it also causes transactions to be sent to each of the other systems.
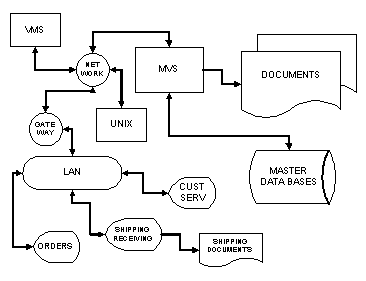
Figure 3 The "Client/Server" System
Capacity planning in a client/server environment is much harder. The systems are no longer isolated and independent. In the example above, if the Shipping workload outgrows the Unix system, it can impact the responsiveness of the Order Entry transactions. In addition, growth in the Order Entry workload will now impact the Unix system, but only if the orders are from existing customers.
Modeling in this environment is truly a challenge. Each of the systems requires a different knowledge base and expertise (Gunther 1995; Hatheson 1995). The systems cannot be modeled independently because the transaction arrival rate for one system may be dependent on the response times of the others. The client software on the PWS may issue transactions to several servers (send everything about customer #123) or it may have to wait for one response before sending the next (what is Jones' customer number; then send everything about that number). While the former situation will cause the instantaneous peaks to synchronize on all of the servers; the latter will slow everything down as one of the servers becomes overloaded and its response times increase. "While it is important to be able to model specific UNIX or NT hardware, the problem we face is modeling the environment that has a diverse collection of hardware, operating system, database management system, and network hardware." (Domanski 1995).
The key to the capacity planning methodology discussed so far is the ability to predict the performance of a future workload given a desired system configuration. As applications move more and more towards being transaction based, the definition of application performance becomes centered around transaction response time. For this reason, modeling the transaction response time of a application is crucial to the ability to predict the future performance of that application.
There are two basic modeling techniques used for computer performance modeling: simulation and analytic queuing theory (Kobayashi 1981; Menascé, Almeida et al. 1994). A third technique, hybrid modeling, is the combination of both simulation and analytic techniques in a single model (Kobayashi 1981). The following sections will provide a general background in these techniques required for the later discussion of Simalytic Enterprise Modeling. They are not intended to offer an in-depth explanation of the modeling techniques, but rather, to provide a brief overview of each and to introduce the simplified mathematical formulae for each that will be used to construct the foundational formula for Simalytic Modeling.
Either of the above techniques will build a model that represents the major components of the computer system to be modeled. Although there are exceptions, generally the resources of interest when looking at the response time of transaction based applications are processor and disk. Figure 4 Simple Transaction Model shows a graphical representation of this model. Transactions enter the system from the left, wait in the processor queue and are served by the processor. At this point the transaction will either leave the system or move to the disk queue and then the disk server. Then the transaction goes back for processor service.
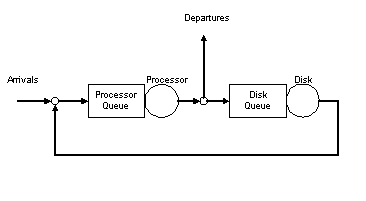
Figure 4 Simple Transaction Model
Figure 4 is a very common diagram of the life of a transaction inside the OLTP system, where reliable response time measurement data is available (Buzen 1984). This view is common because a transaction always starts and ends with some amount of processing, even if only enough to do a disk access. The transaction response time is a measure of the time from when the transaction enters the system until it leaves. In a system with a very low arrival rate there will be little or no queuing. When the system gets busier and the time between transactions (the interarrival time) is shorter than the time to service the prior transaction, then queues will form for one or more of the servers. If the arrival rate continues to increase such that every interarrival time is shorter than the sum of the server service times, the queues will never be emptied and the system is considered to be saturated (Buzen 1984).
Until recently, network delay has not been regarded as part of the transaction response time when planning the capacity of a system for two reasons. First, it is controlled by network hardware and communications lines, which are seldom affected by processor or disk upgrades. Second, the network delay for a given transaction will depend on the path through the network the transaction takes, which may vary greatly from one end-user to another. However, many client/server applications tend to group multiple OLTP transactions together for what the end-user sees as a single business transaction. This means that a model of the systems running the application must include network delays to provide an accurate representation of interdependencies between the systems in the enterprise (Domanski 1995).
"Analytical models capture key aspects of a computer system and relate them to each other by mathematical formulas and/or computational algorithms." (Menascé, Almeida et al. 1994, p. 45).
Analytic models can be implemented many different ways from paper-and-pencil to spreadsheets to advanced commercial products. One analytic technique, queuing theory, plays the most dominant role in the area of capacity planning because capacity and performance problems are most often related to queuing delays caused by contention for resources within a system (Kobayashi 1981).
These models are usually more efficient to execute than simulation models, but they are also often less accurate because the mathematical formulae normalize all activity for each server in the model. For example, building a simple analytic model from actual transaction performance data would result in a single workload based on the average transaction arrival rate with each transaction using the average processor time and the average disk time. If there is very little difference in the individual transactions, then this model will provide very good results. However, the much more common situation is that the variation in the transactions will result in a model that is difficult to validate and poor at prediction because most of the actual transactions are not represented by the average calculated in the model.
Determining how closely the average transaction matches the actual transactions is one of the important activities in model calibration. When a model cannot be calibrated it is often because the workloads being modeled are not homogeneous. The workloads must then be restructured in the model to reduce the variation between the average transaction and the actual transactions. This is referred to as workload characterization and is one of the foundational concepts required for any modeling activity. The interested reader will find a full discussion in (Menascé, Almeida et al. 1994; Domanski 1995).
The mathematical formula for the average response time (T) of transactions in a simple single-server analytic model is shown in Equation 1 Analytic Response Time Formula from (Menascé, Almeida et al. 1994, p. 108) where S is the average time spent at the server and is the average arrival rate of transactions. A detailed description of this formula and its application can also be found in (Buzen 1984).
Equation 1 Analytic Response Time Formula

"The simulation model describes the operation of the system in terms of individual events of the individual elements in the system. The interrelationships among the elements are also built into the model. Then the model allows the computing device to capture the effect of the elements' actions on each other as a dynamic process." (Kobayashi 1981, p. 221).
There are many types of simulation models and techniques. Trace-driven simulations are of more use in capacity planning and performance modeling because they remove one major issue in model construction; transaction arrival distribution. Self-driven simulations generally assume some distribution pattern such as normal or Poisson distributions which may or may not represent the actual distribution of application transactions (Kobayashi 1981). Regardless of the underlying technique used in the simulation tool, there are two important characteristics of these tools. The first is the ability to maintain the identity of each transaction, and its associated attributes, throughout the entire model and have the model react to these attributes. The second is the ability to preserve the specifics of the interarrival times between individual transactions.
The mathematical formula to estimate the average response time (T ) of transactions in a simple single-server simulation model is shown in Equation 2 Simulation Response Time Formula from (Menascé, Almeida et al. 1994, p. 108) where Ti is the response time of the ith transaction and nt is the total number of transactions that visited the server during the simulation.
Equation 2 Simulation Response Time Formula

"A hybrid synthetic model consists of both subsets of the real workload and specially constructed components." (Menascé, Almeida et al. 1994, p. 44).
"Hybrid modeling: a combination of analytical procedures and simulation. So long as the interfaces between different levels or submodels are clearly established, the mixing of analytic and simulation techniques should present no technical problems." (Kobayashi 1981, p. 20).
A hybrid model combines two or more different techniques for a variety of reasons, such as complexity reductions, performance improvement or analysis flexibility. There are many examples of hybrid models in capacity planning and computer performance.
There are a number of examples of the use of hybrid models:
The above hybrid models show some commonality in that they rely on the concept of submodels, similar to subroutines in programming, and they develop a technique that allows the best features of each tool to be focused on the problem. Submodels, which are supported by most of the commercially available modeling tools, are a key concept because they allow some part of the model to be replaced with a different model as long as it provides the same functionality.
In addition to the choice between analytic and simulation tools, the capacity planner or performance analyst has the choice between platform-centric and general purpose tools. The basic difference between these two groups is the problem set the tools were designed to address.
Platform-centric means that the tool contains detailed information about the platform, but does not allow more than one platform to be modeled at a time. Examples of platform-centric information include the number and type of processors for each model of a system built by a given vendor (e.g. IBM 9021-982 8 processors @ 60 MIPS each), the speed and transfer rate of disk devices by manufacturer (e.g. EMC 5500-128 Read (cache hit) = 1.5 ms @ 4.5 MB/sec, Read (cache miss) = 13.5 ms @ 4.5 MB/sec, Write = 1.5 ms @ 4.5 MB/sec; all for a 4K block of data), and operational issues based on the level of the operating system (e.g. MVS/SP 1.3, MVS/XA 2.2, MVS/ESA 5.1).
Platform-centric models are often easier to build because they are made of "building blocks" already defined to the tools and the relationships between them are fully understood by the model. However, these tools cannot be used to model an environment not built into the tool. For example, a tool with the above "building blocks" could not be used to model Unix running on an HP system. Although many platform-centric tools allow the user to define new servers with new performance characteristics, most do not provide large libraries of device and system definitions dramatically different from the supported platform. Platform-centric tools are generally implemented using analytic or queuing theory modeling techniques and process performance and configuration data collected from existing running systems.
General purpose means that the tool contains the features to allow the user to model anything they would like to build, but with little or no "built-in" understanding of any given platform. These tools are used to model more than just the hardware, but also such things as the design of an application, traffic flows and communications networks. Using the example above, the model builder would have to understand the design of the IBM 9021-982, how the eight processors communicate, and what is involved in completing a unit of work within the operating system. A platform-centric tool might contain a variable for the delay caused by dispatching a task on a different processor and set the value of that variable when the model starts based on the system vendor and model, the operating system version and type, and the current configuration (such as memory). The modeler using a general purpose tool would be required to either build a sub-model to simulate the underlying architecture or to determine a delay value to use whenever the event happened. Simulation of the architecture is much more accurate but also much more difficult and time consuming.
Although many general purpose tools provide libraries of sub-models for a variety of systems and devices, most do not provide the required level of granularity, being either too general or too detailed for the situation. Modification of these submodels, if allowed by the vendor, can be time and effort intensive. Building the relationships between the submodels is part of the overall model construction and may require an in-depth understanding of all of the submodels used. General purpose tools are generally implemented using simulation modeling techniques.
Simalytic Modeling is a hybrid modeling technique based on the hypothesis that it is possible to develop a modeling methodology using a general purpose simulation modeling tool as a underlying framework and an analytic modeling tool (or the results thereof) to represent individual nodes or systems when predicting the capacity requirements of heterogeneous computer systems in an enterprise level model.
There are two key differences between the existing modeling tools and the Simalytic Modeling Technique. The first is the ability to use the results from not only a different tool, but a different modeling technique altogether, as a submodel within an enterprise model. The second is the ability to use the results from tools or techniques already being used to model individual nodes in the system. These differences reduce the time and effort to build an enterprise level model by using the results from commercially available platform-centric tools or existing detailed application models.
Simalytic Modeling brings together existing performance models and application information. It is not a technique for collecting data or measuring systems or applications. There are several underlying assumptions that must be true before the Simalytic Enterprise Modeling technique can be used:
The model builder must already understand the applications and the individual systems in the enterprise before they can be put together into an enterprise level model. Using the example from section 2.1.4 Client/Server Environment, the relationship between the Order Entry transactions and the Shipping system must be understood and measurable. If the model builder does not have any information about which transactions send requests to the Shipping system, he cannot build a model that matches the application. Once the application is understood, the model builder must know how each system reacts to different transaction loads. How this information is developed will vary across the different nodes depending on particulars such as the hardware, the operating system and the level of data collection. Techniques for developing a lookup table of valid response time predictions for each node include collecting measurement data at different transaction rates; using platform-centric modeling tools or calculating expected response times based on benchmarks. The fully implemented Simalytic Model would integrate a platform-centric queuing theory model into the simulation tool by replacing the submodels for individual systems with calls to the queuing theory tool.
Once the model builder has all of the fundamental information she can construct an enterprise level model. The simplest way to do this is to construct a very high level simulation model of the enterprise, where each system is a single server capable of some amount of parallelism defined by the architecture of each system and of the application. Then, instead of using a pre-defined service time, each server would use a look-up table that maps the transaction arrival rates to service times. In the enterprise model the service time and the response time for each server will be the same because the queue time is accounted for in the response time data for the server. Each node in the simulation model must allow enough parallelism to avoid queuing to enter the node.
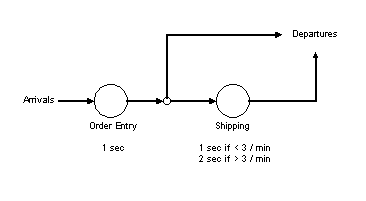
Figure 5 Simple Enterprise Model
Continuing with the same example, some number of the Order Entry transactions would be routed to the Shipping server. Assume it has been determined that Shipping can provide a response time of one second when arrivals are less than three per minute and a response time of two seconds when arrivals are more than three per minute. When the Order Entry transaction rate increases such that more than three per minute are sent to Shipping, the response time will jump from one to two seconds. This is a very simple example, but it illustrates the point. The increased service time at Shipping will cause the overall response time for those transactions to increase, which will be seen as a longer average response time or reduced through-put for the application.
Figure 5 Simple Enterprise Model shows a diagram of this model. The response time is measured from Arrivals to Departures, either through the Shipping node or around it. If there is a limit on the number of transactions that can be active in the Order Entry system at any given time, then there could be some queuing to get into the system. This would represent a user's workstation waiting to send the transaction to the server. This example shows how the Simalytic Model connects what is happening in the application on the different servers. If the Order Entry system is modeled by itself, the workload representing the long (Shipping) transactions would not reflect the increased response time due to the load at Shipping. Because of the additional application information in the Simalytic Model, it could adjust the service time in the Order Entry server by replacing the measured wait time component of the response time with the projected delay from the Shipping server. This is a level of detail beyond the initial discussion of Simple Enterprise Modeling in this paper, but technique lends itself to this type of extension.
The next question is "how does the Shipping server know what arrival rate to use for a single transaction?" The arrival rate must be calculated for each transaction based on how long it has been since the prior transaction (the transaction interarrival time). If the interarrival time is less than 20 seconds, then the arrival rate to account for that interarrival time would have to be greater than three per minute. If the interarrival time is longer than 20 seconds, then the arrival rate would have to be less than three per second. Therefore, knowing the interarrival time between each pair of transactions, the model can calculate the instantaneous arrival rate at each server. As shown in Figure 6 Shipping Transaction Arrivals, when the transaction arrivals are close together the response time is high and when the arrivals are further apart the response time is low.
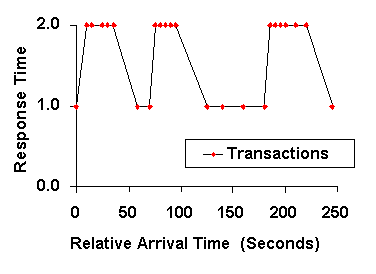
Figure 6 Shipping Transaction Arrivals
The next step is to analyze the model using the business objectives. Assume that the manager of the Order Entry department has requested a model to determine when the Order Entry system will need to be upgraded in order to maintain the required response time of less than 1.7 seconds. The arrival rate is assumed to have a constant increase over the next 18 months (the scope of the analysis) and the percent of the Order Entry transactions must also query the Shipping system is assumed to be 30%. The response time goal for the Shipping system is less than 10 Seconds (because these transactions generally do not involve a waiting customer) and this response time is acceptable. The objectives of the analysis are to answer two questions: "When does the Order Entry system fail to meet the business response time goal?" and "What will fix the problem?".
Equation 3 Simalytic Response Time Formula
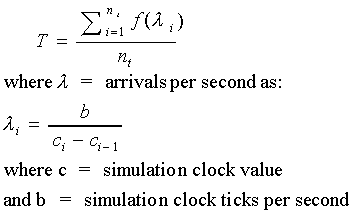
Figure 7 Model Results Analysis shows the hypothetical results of this example model. When each of the systems are analyzed independently, neither of the response times ever approach the business goal of 10 seconds for the Shipping transactions and 1.7 seconds for the Order Entry transactions. However, when the relationship between Shipping and Order Entry is added to the chart in the form of results from a Simalytic Model, the revised Order Entry response times show that system will need to be upgraded by year end, well within the scope of the analysis. In addition, the 'fix' to the problem is to upgrade the Shipping system, which never exceeds its response time goal. The Simalytic Model allows the analyst to see the impact of relationships that, although known, may not be full appreciated.
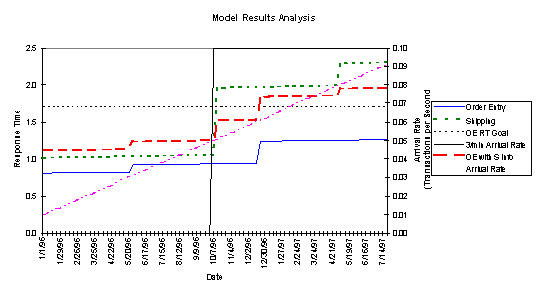
Figure 7 Model Results Analysis
The above example shows how simulation and analytic modeling techniques can work together, but it does not prove that Simalytic Modeling is a viable technique. To do that we need to look at the mathematical formulae behind the two techniques and how they are combined into the Simalytic Modeling formula shown in Equation 3 Simalytic Response Time Formula. As the framework for a Simalytic model is a simulation model, we start with the simulation response time formula shown in Equation 2. The server time from each iteration (Ti) is replaced with a function f (i), where i is the iteration and is the arrival rate per second calculated from the interarrival time by dividing the number of simulation clock ticks per second (b) by the difference in the simulation clock value for the current iteration and the prior iteration (ci ci1) as shown in Equation 3.

Figure 8 Interarrival Time Example
The function f is based on the results of the analytic response time formula in Equation 1, either directly or indirectly. Directly means that the simulation modeling tool would invoke a submodel to calculate and return the response time based on . Indirectly means that the analytic formula has been invoked at some other time for some subset of the expected values for and the response times placed in a look-up table. The simulation model then invokes a submodel that returns the response time for the closest found in the table.
Figure 8 Interarrival Time Example shows an example of how the arrival rate can be calculated from the interarrival times between transactions. The i th transaction (ti) arrives at the clock value of cj, but as it is the clock value for the i th transaction, it is also referred to as ci. The arrival of the prior transaction (ti1) is at ci1 (or cj3). Therefore, the interarrival time for ti is iri, which starts at the prior arrival (ai1) and is calculated as the clock value at ai (ci º cj) minus the clock value at ai1 (ci1 º cj3) which is three. If there are six clock ticks per second, then 6/3 = 2, or an arrival rate of two transactions per second.
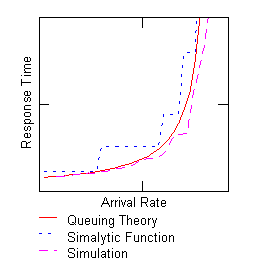
Figure 9 Simalytic Function
Once the arrival rate is calculated, the function (f) is called with the rate for that transaction (I). The function will approximate the results of the queuing theory formula Equation 1 Analytic Response Time Formula to a greater or lesser degree, depending on the complexity designed into f. Figure 9 Simalytic Function shows a stylized view of the relationship between this function (the short broken line) and the results of Equation 1 (the solid line) and the results a of series of simulations at different arrival rates (the long broken line).
Equation 3 only calculates the response time for a single workload on a single server. The response times for additional workloads and servers would be calculated the same way. The average system response time could then be calculated by adding the response times together based on the probability of each workload visiting each server. As can be seen by this simple example, the calculations will quickly grow out of hand. To avoid this, the Simalytic Modeling Technique uses existing simulation and queuing theory tools together to implement a Simalytic Model. In addition, the simulation tools allow transactions to be assigned attributes that can contain application design information not available in the measurement data.
Simalytic Enterprise Models should be validated at two levels. First, each model used for a system or node in the enterprise must be validated and calibrated for that system. This not only means that the response time versus load (arrival rate) relationship is valid for all arrival rates seen, but that it also holds across all of the possible arrival rates for all workloads likely to be generated by the enterprise model. If a submodel does not accurately represent the "knee" in the response time curve of one of the systems, such as the one in Figure 9, the enterprise model will not accurately predict beyond that point. Second, because Simalytic Enterprise Modeling includes a model of the relationships within the applications being modeled, measurement data must be collected to validate those relationships. If the model from above (see Figure 7) shows 30% of the Order Entry transactions are routed to Shipping, the model builder must collect the data to support that assumption.
Neither of these validation issues is easy. The first requires more effort than just modeling individual systems because each system can influence the others. Other workloads on any of the systems can impact the applications being modeled. One system can host more than one application being modeled at the enterprise level, which would require the submodels to have information about both to calculate the response time for either. The second issue requires a level of understanding and documentation of both the systems and the applications that many organizations simply do not have available. Most applications do not collect information about execution paths, spawned transactions and client/server requests. In addition, many of the client/server operating systems and OLTP systems today do not collect enough, or sometime even any, detailed information about the transactions.
Simalytic Enterprise Model validation will require more time and effort than the validation of single system models. Until better cross-platform application measurement tools are in place, the most promising validation technique appears to be the 'model the past to predict the present' approach. Simply stated, this technique is applied after all other issues are thought to be resolved. A model is built from measurement data collected from a different enterprise environment, usually at a lower transaction volume. Growth is then applied to the model to see if it predicts what can be currently measured. If it can, then there is a good confidence in the predictions of the future. If it cannot, the model must be revised. Until measurement data improves, many situations will require the modeled changes to be implemented and measured before they can be validated. This is a classic "Catch-22" situation. Why collect the data when we cannot do anything with it and why build a tool that requires non-existent data? Simalytic Modeling provides a technique to use the existing data with the existing tools and refine the process as each improves.
A practical implementation of the Simalytic Enterprise Modeling technique is to develop an interface between existing general purpose simulation tools such as SES/Workbench (SES ), Qase (AST ), Pro-Sim (MSI ), ProModel (ProModel ) or Simul8 (Visual ) with existing platform-centric queuing theory tools such as Best/1 (BGS ), OptiModel (CA-Legent ), CMF/MODEL (B&B ) or ATHENE (MSI ). In addition, other tools could be used in place of the platform-centric analytic submodels, including design engineering models such as SPE*ED (PES ; Smith 1995) and general analytic tools such as QSolver/1 (Menascé, Almeida et al. 1994). This partial list of tools is not intended to include all tools that could be used with this technique. This list represents some of the tools the author has had some level of experience with and believes should be usable in building an Simalytic Enterprise Model. Both the list of simulation tools and the list of analytic tools is large enough to show that the Simalytic Enterprise Modeling technique is a general methodology with broad application and not a specialized implementation of a single tool.
Capacity planning for single platform computer systems has developed over the years into a well disciplined field, but only if the input parameters and goals are well defined. Predicting the resource requirements in a client/server environment is possible, but again, only if the input parameters and goals are well defined. Applications designed to exploit a client/server architecture greatly increase the complexity of both the computer system configurations and the applications themselves. Predicting the responsiveness of those more complex applications requires a more complex modeling methodology.
Modeling an application at the enterprise level requires an understanding of the applications and measurements of the transaction response times. Different modeling techniques (simulation, analytic queuing theory or hybrid) and different modeling tools (platform-centric or general purpose) can be used to predict transaction response times for individual systems or nodes. But none of these can be used alone to produce a detailed enterprise level model at a reasonable development cost. The expense, time and effort to plan the required future capacity of a system must be substantially less than the cost that is being avoided. It has been possible to devote a great deal of time, effort and money to capacity planning in the mainframe arena because the equipment costs to be avoided were so very large. The lower equipment costs and scarcity of experienced planners in the distributed environments have often made the cost to be avoided less than the cost of planning. Unfortunately, both of these situations are changing as mainframe equipment costs spiral down and client/server complexities push the enterprise costs up. The cost to be avoided may still be too small to justify the effort, but the key is finding where the real problem is. Adding equipment that fixes several non-problems quickly changes the equation in favor of effective capacity planning.
Simalytic Enterprise Modeling can be used to take advantage of
existing application and system models to reduce the time and
effort to produce detailed enterprise level models. Although the
methodology is still being developed, the technique described
in this paper can be used very cost-effectively at a high level,
such as shown in Figure 7 Model Results Analysis. This level of
analysis, although not very precise, provides insight into the
application's future performance that would not otherwise be available.
Using the technique will both improve the understanding of the
application as well as identify which systems require more detailed
analysis and which systems will continue to meet the business
needs without additional equipment. The implementation of the
technique using any of the many existing tools not only protects
the investment an organization has made in tool acquisition and
training, but it also will reduce the time and effort to produce
a model that will predict the impact of business growth on the
entire enterprise.
Simalytic ModelingTM, Simalytic Modeling TechniqueTM and Simalytic Enterprise ModelingTM are trademarked by Tim R. Norton. All other trademarked names and terms are the property of their respective owners.
© 1996 Tim R. Norton. All rights reserved
The author would like to thank the referees and editor for their careful reading and helpful comments. A special thanks is expressed to Dr. Jeff Buzen and Mr. Rick Lebsack for their interest and in-depth critiques of the early versions. A special thanks is also expressed to Dr. John Zingg, Dissertation Committee Chair, for his insight and assistance.
AST QASE. 12200 E. Briarwood Ave., Suite 260, Englewood, CO 80112, Advanced System Technologies.
B&B CMF/MODEL. 510 Oakmead Parkway, Sunnyvale, CA 94086, Boole & Babbage, Inc.
BGS Best/1 and Crystal. 128 Technology Center, Waltham, MA 02254, BGS Systems, Inc.
BGS (1996). UNIX Client Server Sizing and Performance, BGS Systems, Inc: 12.
Buzen, J. P. (1984). A Simple Model of Transaction Processing. CMG Proceedings, Computer Measurement Group.
CA-Legent OptiModel. PO Box 9345, Framington, MA 01701, Legent Corporation.
Domanski, B. (1995). Capacity Management for Client-Server Architectures: Techniques & Systems Management Issues. CMG Proceedings, Computer Measurement Group.
Ghosh, D., I. Murthy, et al. (1992). "File Allocation Problem: Comparison of Models with Worst Case and Average Communication Delays." Operations Research 40(6): 1074-1085.
Gunther, N. J. (1995). Performance Analysis and Capacity Planning for Datacenter Parallelism. CMG Proceedings, Computer Measurement Group.
Hatheson, A. (1995). Two Unix Client/Server Capacity Planning Case Studies. CMG British Proceedings, Computer Measurement Group.
Kobayashi, H. (1981). Modeling and Analysis: An Introduction to System Performance Evaluation Methodology. Reading, MA, Addison-Wesley Publishing Company.
Lehmann, A. (1984). A Multi-stage Hierarchical Performance Evaluation Concept - Design, Application and Experiences. CMG Proceedings, Computer Measurement Group.
Menascé, D., V. Almeida, et al. (1994). Capacity Planning and Performance Modeling: from mainframes to client-server systems. Englewood Cliffs, New Jersey, Prentice Hall.
MSI Pro-Sim and ATHENE. 352 Hungerford Dr., Suite 400, Rockville, MD 20850, Metron Systems Inc.
PES SPE-ED. P.O. box 2640, Santa Fe, NM 87504, Performance Engineering Services.
Place, J. P. (1986). A Capacity Planning Model Relating the Degree of Multiprogramming, Page Fault Rate and CPU Utilization in a Large Computing System. CMG Proceedings, Computer Measurement Group.
Pooley, R. (1995). "Performance Analysis Tools in Europe." Informationstechnik und Technische Informatik 37: 10-16.
ProModel ProModel. Orem, UT (801) 223-4600, ProModel Corp.
Rosenberg, J. L. and E. M. Friedman (1984). Capacity Planning in a Decentralized Environment. CMG Proceedings, Computer Measurement Group.
SES SES Workbench. 4301 West Bank Dr. Blgg A, Austin, TX 78746, Scientific and Engineering Software, Inc.
Smith, C. U. (1995). "The Evolution of Performance Analysis Tools." Informationstechnik und Technische Informatik 37: 17-20.
Taylor, D. J. (1994). "Hybrid modeling: The next step." Computer-aided Engineering 13(7): 32-35.
Visual Simul8. 141 St James Rd., Glasgow, UK G4 0LT, Visual Thinking International Limited.
Wicks, R. (1989). Balanced Systems. CMG Transactions, Computer Measurement Group.
Wilson, G. L. (1994). Capacity planning in a high-growth organization. CMG Proceedings, Orlando, FL, Computer Measurement Group.